The role of technology in driving efficiency
A look at technology’s role in driving efficiency for hospitality operations, and strategies you can implement today to get the most out of your tech.

The art of menu design (also known as menu engineering) is one of the most valuable tools in your arsenal for increasing profit and improving customer experience.
By combining initiatives like upsells, customisation and strategic menu placement, operators can increase ATV by up to 35%.
Menu design strategies might vary between different brands, but the most successful approaches all have one thing in common: they start with analysis.
In this guide, we provide you with a free menu analysis worksheet, which includes clear instructions for every part of the process. You’ll have the tools to analyse the performance of your menu items, and turn the insights into a winning menu design plan.
When you’re looking to improve your menu, the essential first step is to analyse how your menu items currently perform.
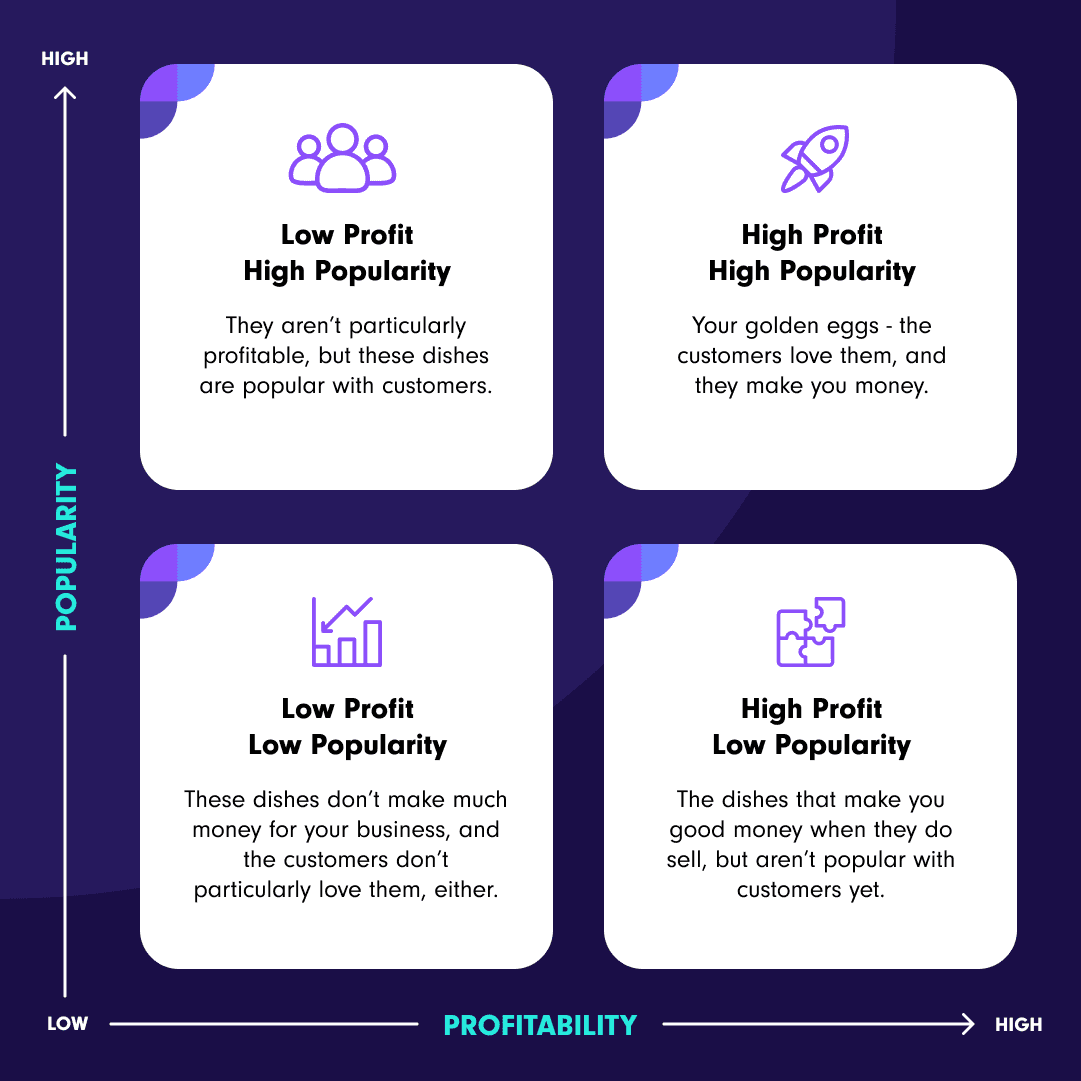
Our free menu design worksheet categorises your items by profit and popularity – giving you a strong foundation on which to build your menu design strategy.
All you need to do is input some simple sales data, and you’ll get both an item-by-item analysis, and a big-picture view of how your menu performs.
1. Choose a time period to analyse. We recommend your last completed quarter, but you can choose any period that suits your operation.
Make a copy of the Data tab and name it appropriately e.g ‘Q4 2022’ or ‘Week 5 2023’.
2. Note down the names of the menu items you want to analyse. You can focus on a specific category in your menu (e.g ‘Sides’) or look at your menu as a whole.
3. Record the number sold of each item. This data will be easily accessible in your reporting tools, which should tell you exactly the number sold of each item in your selected time period.
4. Record the Cost of Goods for each item. [need insight from tobias on this one]
5. Note the sales data for each item. Finally you now need to input sales data for the time period against each menu item. This data includes: Gross Sales Before Discount, Gross Sales, and Net Sales (after VAT).
With your data inputted, you’ll get both granular and big-picture menu design analysis.
The following values are automatically worked out, and show you insight into the revenue of each menu item. These are used to work out the all important Profit and Popularity categories later on.
These are the all important menu design categories that will inform your strategy for each menu item moving forward.
Each item is automatically categorised as either Low Profit or High Profit, and as either Low Popularity or High Popularity. This puts each into one of the following categories:

Having categorised your items’ profit and popularity, you are now empowered to make data-backed decisions about your menu.
Here are some quick-wins to help get you started…
With the right setup, your menu can be your hardest working member of staff by increasing ATV and improving customer experience.
Book your free demo below.
A look at technology’s role in driving efficiency for hospitality operations, and strategies you can implement today to get the most out of your tech.


The right hospitality tech partner does more than provide software. They collaborate, innovate, and scale with your business.
